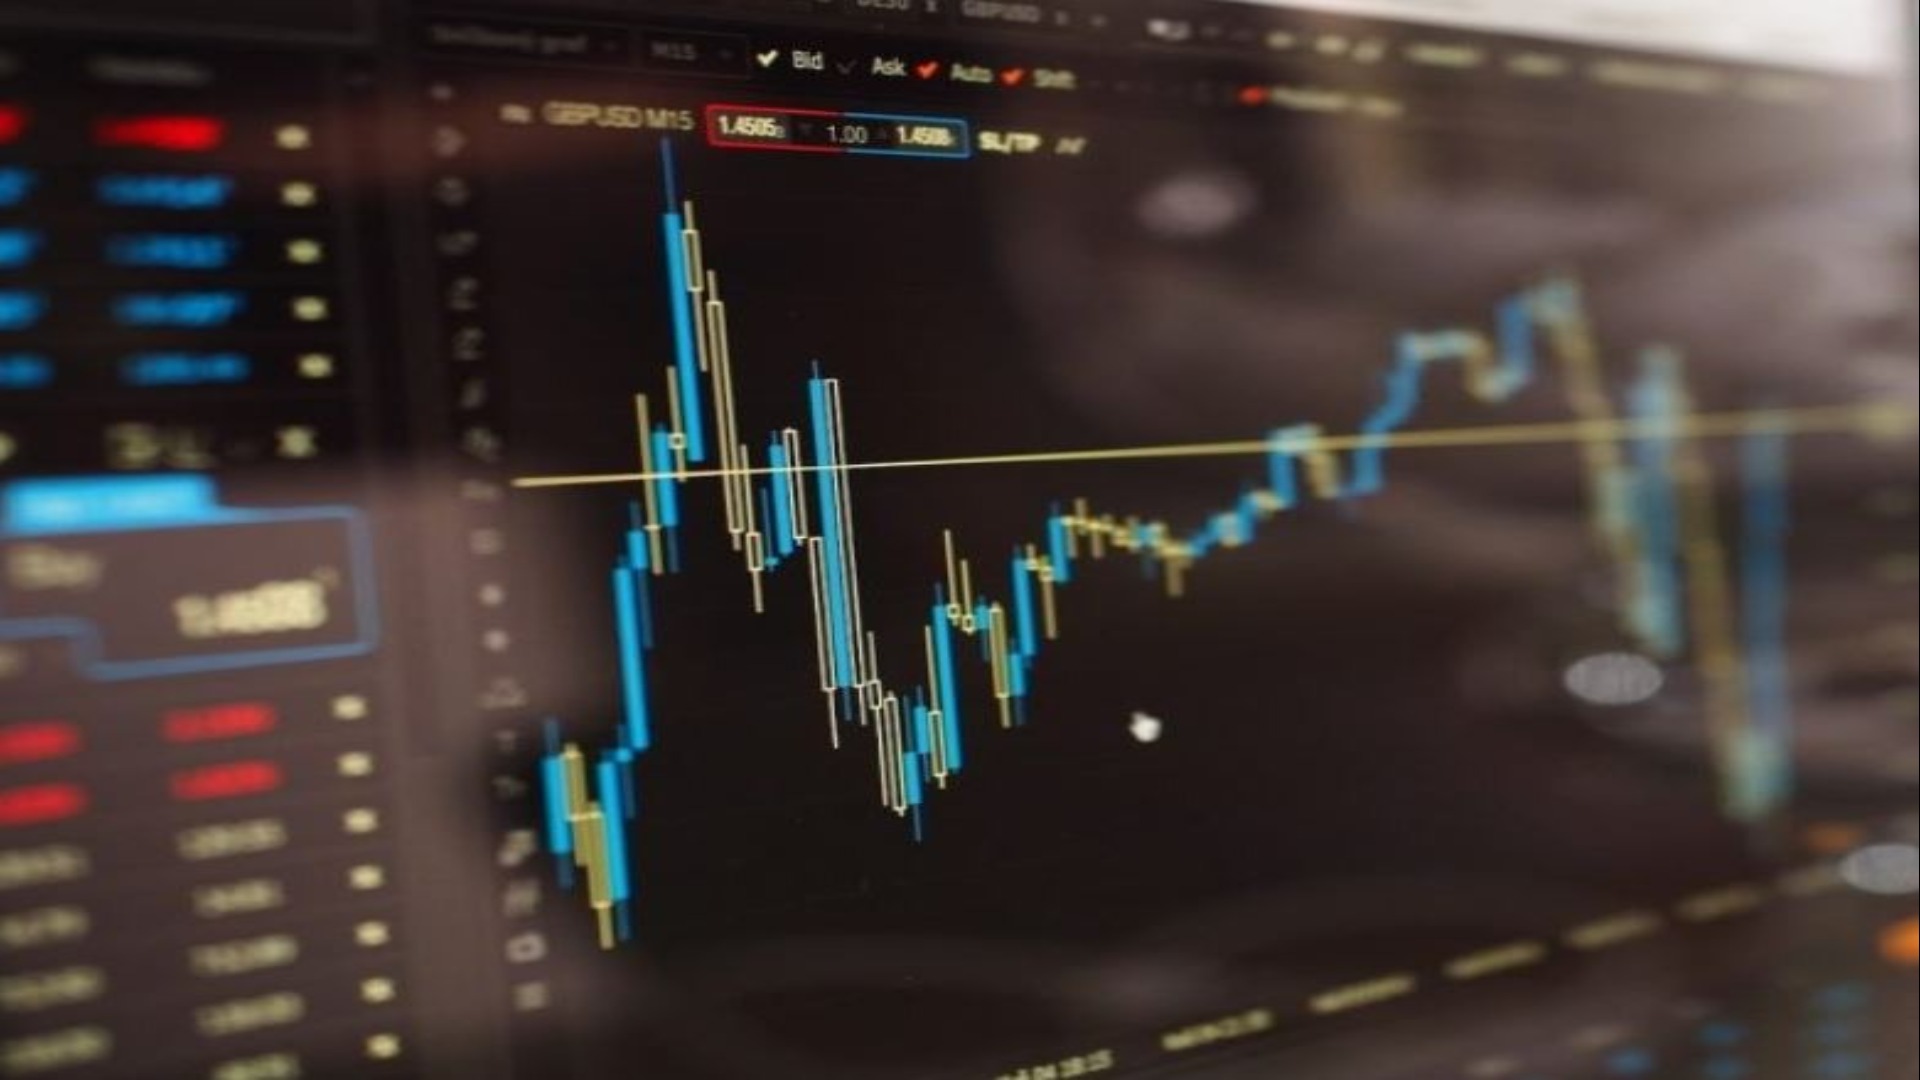
Understanding Fibonacci Retracements
Fibonacci retracements are a tool derived from the golden ratio, a mathematical concept that appears frequently in nature and finance. In the context of forex, the retracement levels are used to identify possible support or resistance zones within a price move. The most common levels—23.6%, 38.2%, 50%, 61.8%, and 78.6%—are plotted by drawing a trendline from a recent swing low to a swing high (or vice‑versa) and then marking the percentages of the vertical distance between those points.
The underlying principle is that after a pronounced move, price often retraces a predictable portion of that move before continuing in the original direction. By visualising these zones, traders can anticipate where a pullback may stall and a reversal could begin.
Calculating Key Levels
- Identify the swing points: On a chart, locate a clear low and a subsequent high (for an uptrend) or a high and a subsequent low (for a downtrend). These points define the range of the move.
- Measure the distance: Calculate the difference between the high and the low. For an uptrend, subtract the low from the high.
- Apply the percentages: Multiply the distance by each Fibonacci percentage. Add the result to the low for an uptrend (or subtract from the high for a downtrend) to obtain the retracement levels.
- Plot the levels: Use charting software that offers a built‑in Fibonacci tool, or manually draw horizontal lines at each calculated level.
Because the levels are fractions of the overall move, they adapt automatically to the size of the swing, making them useful across multiple timeframes.
Identifying Potential Reversal Points
Once the retracement lines are in place, look for confirmation signals that a reversal may occur near a level:
- Price action patterns: A bullish engulfing or a hammer near a 38.2% or 61.8% level can signal a potential bounce.
- Momentum indicators: Divergence between a momentum oscillator (e.g., RSI) and price near a retracement level may hint at a forthcoming change.
- Volume spikes: A rise in volume as price approaches a retracement zone can reinforce the level’s significance.
- Confluence with other tools: When a Fibonacci level aligns with a moving average, trendline, or pivot point, the probability of a reversal increases.
The 50% level is often regarded as a psychological midpoint, but the 61.8% level, which is closely tied to the golden ratio, is frequently considered the most robust retracement for many traders.
Practical Application in Forex Trading
- Set a clear trade plan: Before entering a trade, define entry, stop‑loss, and target levels based on Fibonacci retracements. For example, enter a long position at the 38.2% level, set a stop‑loss just below the 50% line, and target the 61.8% level.
- Use multiple timeframes: Verify that the retracement level holds on a higher timeframe (e.g., daily) while trading on a lower timeframe (e.g., hourly). Confluence across timeframes adds reliability.
- Manage risk: Position sizing should reflect the distance between the entry and stop‑loss. If the stop is far from the entry, reduce the lot size accordingly.
- Monitor for confirmation: Do not enter solely on the retracement line. Wait for a price reversal signal such as a candlestick reversal pattern or a momentum indicator bounce.
- Adjust as the market evolves: If price breaks through a retracement level, re‑evaluate the trade. A breakout may signal a continuation, requiring a stop‑loss adjustment or a trade exit.
By integrating Fibonacci retracement levels with disciplined risk management and clear entry criteria, forex traders can systematically identify potential turning points and improve the consistency of their trading outcomes.