Defining a Crash Versus a Correction and a Bear Market
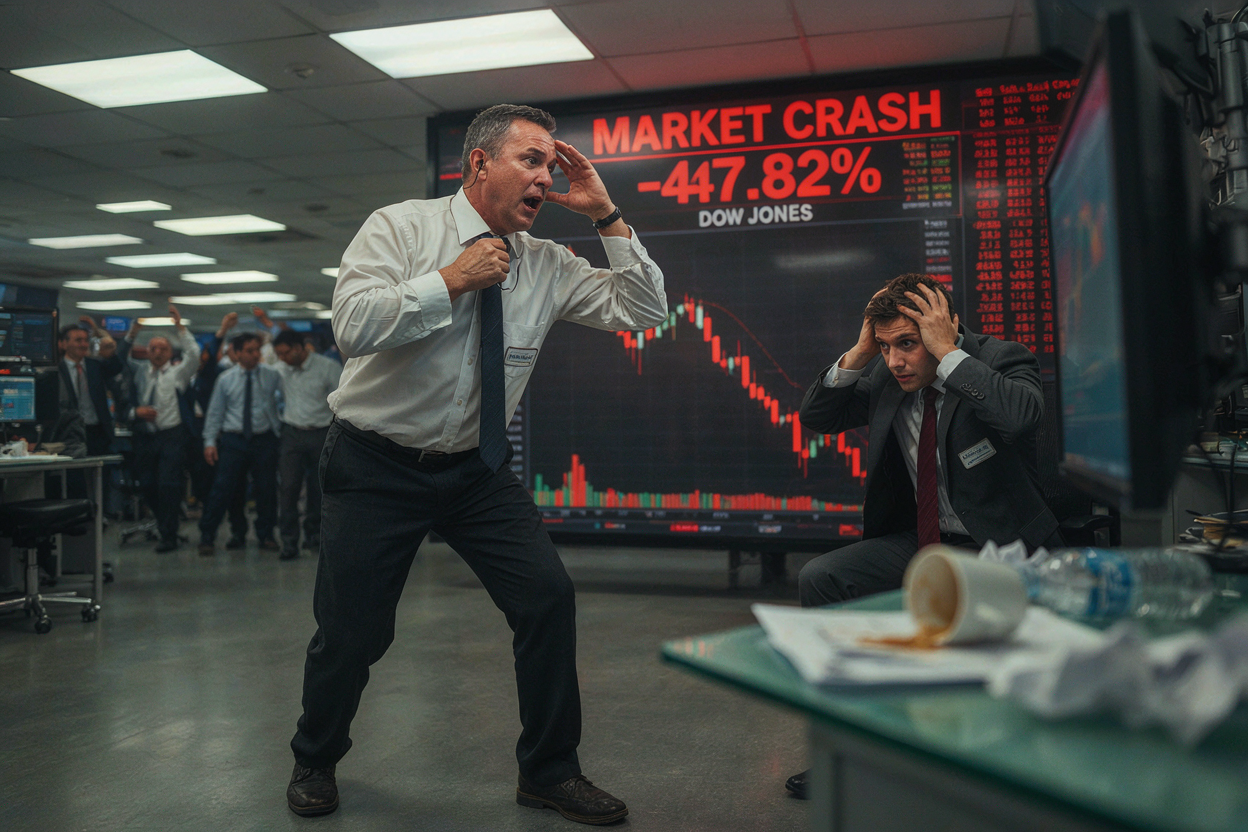
For investors new to market terminology, the distinction between a correction, a bear market, and a full-blown crash is essential. A correction is generally understood as a pullback of roughly 10 percent from a recent peak. A bear market extends that decline to 20 percent or more. A crash, however, is the acute, violent expression of either threshold: a sudden drop of 10 percent or greater in equity prices compressed into just a few trading sessions, driven overwhelmingly by panic selling rather than a gradual reassessment of fundamentals.
History offers a handful of canonical examples. The 1929 Wall Street crash, Black Monday in October 1987 (when the Dow Jones Industrial Average lost approximately 22 percent in a single session), the 2008 global financial crisis, and the sharp March 2020 pandemic plunge all share a common backdrop: stretched valuations, elevated leverage, and a low-interest-rate environment that, once disrupted, exposed fragile positioning. Understanding these structural parallels helps beginners recognize that crashes are rarely random events; they are the violent unwinding of conditions that had been building for months or years.
The 2026 Asian and Global Tech Rout
The most severe damage in the current episode has been concentrated in South Korea. The Kospi index climbed to an all-time high near 9,386 in June before closing at 5,554.27 on 15 October, a one-day loss of 7.56 percent. That puts the index roughly 41 percent below its summer summit. According to reports citing Bloomberg, it was the worst weekly performance the benchmark had posted since October 2008.
The weakness was clearly regional. On the same 15 October session, Japan's Nikkei 225 finished down 4.9 percent at 64,425.95, and Taiwan's benchmark closed approximately 3.4 percent lower. In the United States, the Nasdaq Composite fell 1.88 percent on 14 October, marking its worst single-day session since July. Earlier in the year, Hong Kong and mainland China also experienced notable sell-offs in June, underscoring that the fragility was not isolated to any single market. Semiconductor-related names, in particular, sit roughly 20 percent below their June highs, a drag visible across Nasdaq futures and the Hang Seng tech complex.
India has experienced a slower but persistent bleed. The Nifty 50 logged eight consecutive weekly declines leading into early October, pressured by softer oil-linked demand and sustained foreign outflows. In the United Kingdom, investors withdrew an estimated £15 billion from equity funds, yet the FTSE 100 has nonetheless hovered near record territory, illustrating how large-cap index composition can mask underlying selling pressure.
Recurring Patterns and the Role of Trading Halts
The 2026 episode is not a one-off shock. On 5 June, the Philadelphia Semiconductor Index posted its steepest single-day drop since March 2020, falling 10.3 percent and wiping out roughly US$1.3 trillion in market value. Just three days later, the Kospi plunged more than 8 percent. Then, on 14 October, US technology stocks shed over $1 trillion in value as investors rotated into Treasury bonds as a safe haven.
To contain the kind of cascading, forced selling that amplifies a decline into a crash, exchanges around the world deploy automatic trading suspensions—commonly called circuit breakers. South Korea activated such halts back in June and saw the Kospi enter bear-market territory again last week after an 8-plus percent single-session drop, a modern-day crash that unfolded in hours rather than the weeks that characterized 1929 or 2008.
Macro Triggers and Key Indicators for Traders to Monitor
Several macroeconomic and sector-specific factors are feeding the current volatility. September US inflation printed at 3.7 percent, hotter than consensus, which revived concerns about further Federal Reserve rate hikes and dampened risk appetite. Within the technology sector, crowded positions among AI-linked winners became vulnerable as fears over AI-related debt mounted; CoreWeave bonds, for instance, came under pressure. Geopolitical and competitive dynamics also played a role, including China's push through the CXMT memory-chip project and the release of a new DeepSeek model aimed at chip design.
On the energy front, traders are watching the Brent crude benchmark; a sustained price above $100 a barrel could add further inflationary pressure and complicate central-bank policy paths.
From a technical-analysis standpoint, the Kospi's trajectory versus its June high has already breached both the 10 percent correction line and the 20 percent bear-market threshold. Practitioners advising clients in this environment typically stress monitoring several indicators: unusual volume spikes, narrowing market breadth, the CBOE Volatility Index (VIX), and whether price can reclaim broken support levels. Many brokerages now describe AI-related equities as oversold but caution that the path to recovery will be uneven. The prevailing educational takeaway for retail investors is to avoid "catching falling knives" and instead wait for the market to establish higher lows before re-entering.
This article is provided for educational purposes and does not constitute financial advice.